discretize_model
- astropy.convolution.discretize_model(model, x_range, y_range=None, mode=u'center', factor=10)[source] [edit on github]
Function to evaluate analytical models on a grid.
Parameters: model : FittableModel
Model to be evaluated.
x_range : tuple
x range in which the model is evaluated.
y_range : tuple, optional
y range in which the model is evaluated. Necessary only for 2D models.
mode : str, optional
- One of the following modes:
- 'center' (default)
Discretize model by taking the value at the center of the bin.
- 'linear_interp'
Discretize model by linearly interpolating between the values at the corners of the bin. For 2D models interpolation is bilinear.
- 'oversample'
Discretize model by taking the average on an oversampled grid.
- 'integrate'
Discretize model by integrating the model over the bin using scipy.integrate.quad. Very slow.
factor : float or int
Factor of oversampling. Default = 10.
Returns: array : numpy.array
Model value array
Notes
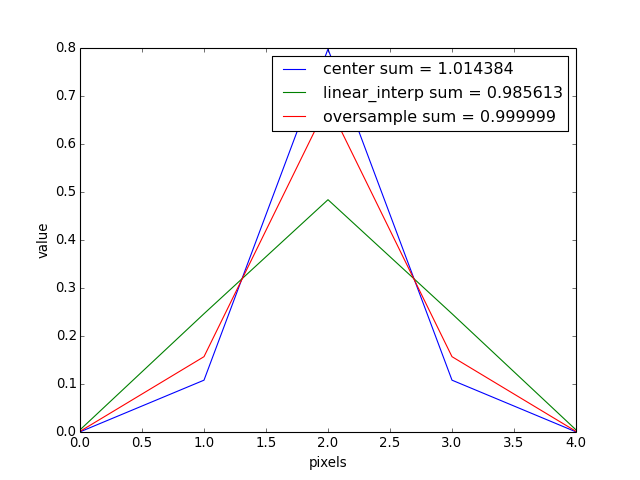
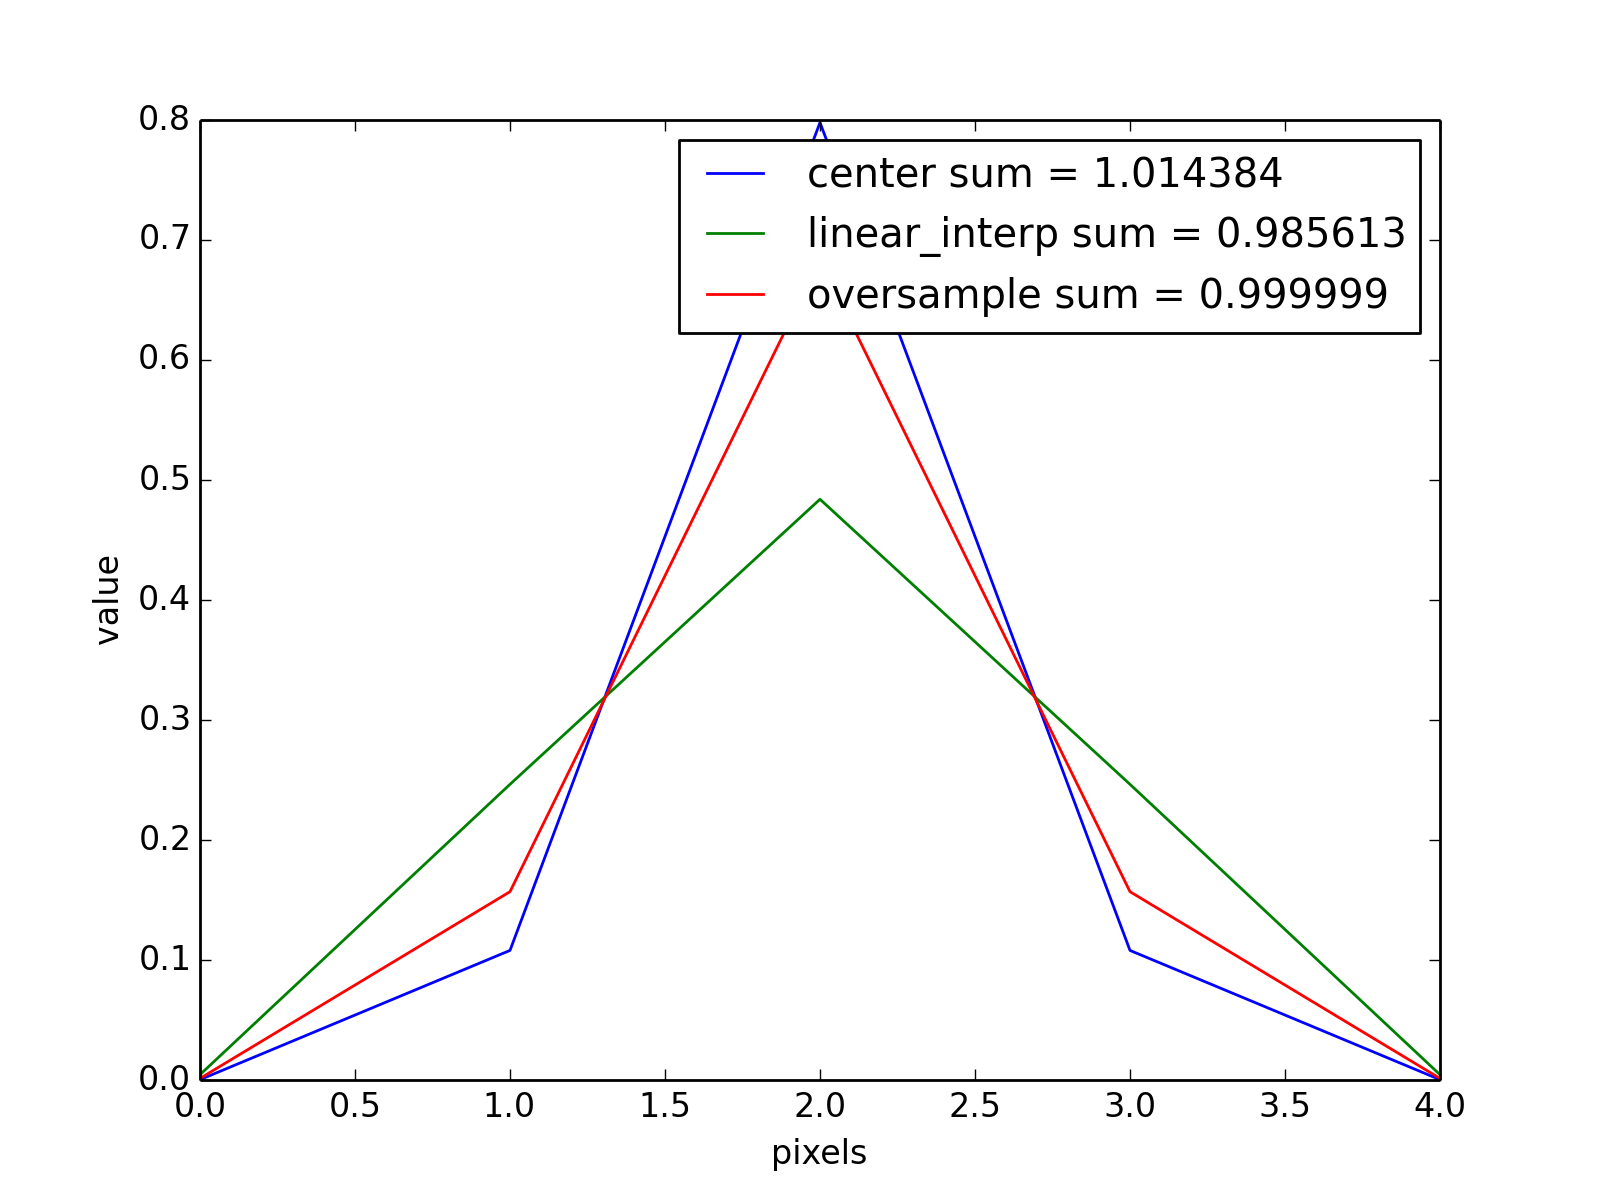
The oversample mode allows to conserve the integral on a subpixel scale. Here is the example of a normalized Gaussian1D:
import matplotlib.pyplot as plt
import numpy as np
from astropy.modeling.models import Gaussian1D
from astropy.convolution.utils import discretize_model
gauss_1D = Gaussian1D(1 / (0.5 * np.sqrt(2 * np.pi)), 0, 0.5)
y_center = discretize_model(gauss_1D, (-2, 3), mode='center')
y_corner = discretize_model(gauss_1D, (-2, 3), mode='linear_interp')
y_oversample = discretize_model(gauss_1D, (-2, 3), mode='oversample')
plt.plot(y_center, label='center sum = {0:3f}'.format(y_center.sum()))
plt.plot(y_corner, label='linear_interp sum = {0:3f}'.format(y_corner.sum()))
plt.plot(y_oversample, label='oversample sum = {0:3f}'.format(y_oversample.sum()))
plt.xlabel('pixels')
plt.ylabel('value')
plt.legend()
plt.show()
(Source code, png, hires.png, pdf)